Case study · 2024–2025
Love Is Human
Find the next show worth going to.
Love Is Human is a band-driven discovery platform — independent artists publish profiles for their shows, music, and merch, and fans browse to find the gigs worth their Saturday night. As lead UX designer on a three-person team, I redesigned the show-discovery experience for fans, lifting user retention by 25%.
Final design
Fans land on a feed they can actually filter, sorted by what's relevant to them.
The problem
Fans were leaving because they couldn't find a show worth attending.
Love Is Human's first version of show discovery was a single chronological feed of every upcoming show on the platform — no grouping, no relevance signal, and filters buried behind an "Advanced search" link almost nobody clicked. Bands kept posting; fans kept bouncing.
The pattern was blunt: returning fans landed on the feed, scrolled a few rows, didn't see anything obviously for them, and closed the tab. That's a discovery problem masquerading as a content problem — there were plenty of shows, fans just couldn't find the right ones.
An unfilterable feed
Genre and location filters existed but lived behind an "Advanced search" link most fans never opened. The default view showed every show, everywhere.
No relevance signal
Every show looked identical on the card. Fans couldn't distinguish a local favorite from a touring act from a one-off slot — so they read nothing.
Sparse detail after click
The show detail page didn't surface venue, price, or the rest of the lineup in one place — fans had to cross-reference multiple screens to decide.
The research
A composite of fan behavior, not a guess.
I ran usability sessions with fans who use platforms like Bandsintown and Songkick to plan their week, and reviewed funnel analytics on the existing feed alongside them. I used ChatGPT and Claude to cluster findings and draft personas, cutting synthesis time roughly in half. The fastest insight came from the sessions themselves: fans were treating the feed like a search engine, but it was behaving like a notification feed.
Out of that came Sam, the fan every redesign decision had to answer to.
Goals
- Find shows worth their Saturday — local, in their genre, in their price range.
- Discover new bands before they sell out, without scrolling a 200-show list.
- Decide whether to buy a ticket in under a minute, without cross-referencing three sites.
Frustrations
- Feeds default to "everywhere" instead of their actual city — irrelevant shows drown out local ones.
- Show cards bury the venue and price — info they need first appears last.
- "Advanced search" treats their normal use case as advanced; the common case has to be the default.
Fans were treating the feed like a search engine, but it was behaving like a notification feed.
The insight that shaped every design decision
The architecture
A four-step conversion path.
The IA had to support a single fan journey end-to-end — from landing to ticket purchase. Everything else on the platform (band profiles, music previews, merch, newsletter) is supporting context for that journey. Mapping it explicitly kept the design honest: every screen had to earn its place in the flow.
Land on discovery
Fan sees a feed pre-filtered to their city, sorted by soonest.
Narrow down
Genre, when, price, vibe — chips in the right rail update results live.
Open show detail
Date, lineup, venue, price tiers — every signal in one place.
Get tickets
Tier selection to checkout in two clicks, no leaving the page.
The process · 01
Started on paper.
I sketched the whole platform on paper first — discovery, show detail, band profile, music player, event hero — to lock in information architecture before getting precious about pixels. The four screens that mattered most for the show-discovery story were drawn over a single afternoon, with margin notes capturing the features (filters, newsletter, ticketing, festival resources) and the constraint that fans should be able to decide on a show in under three seconds per card.
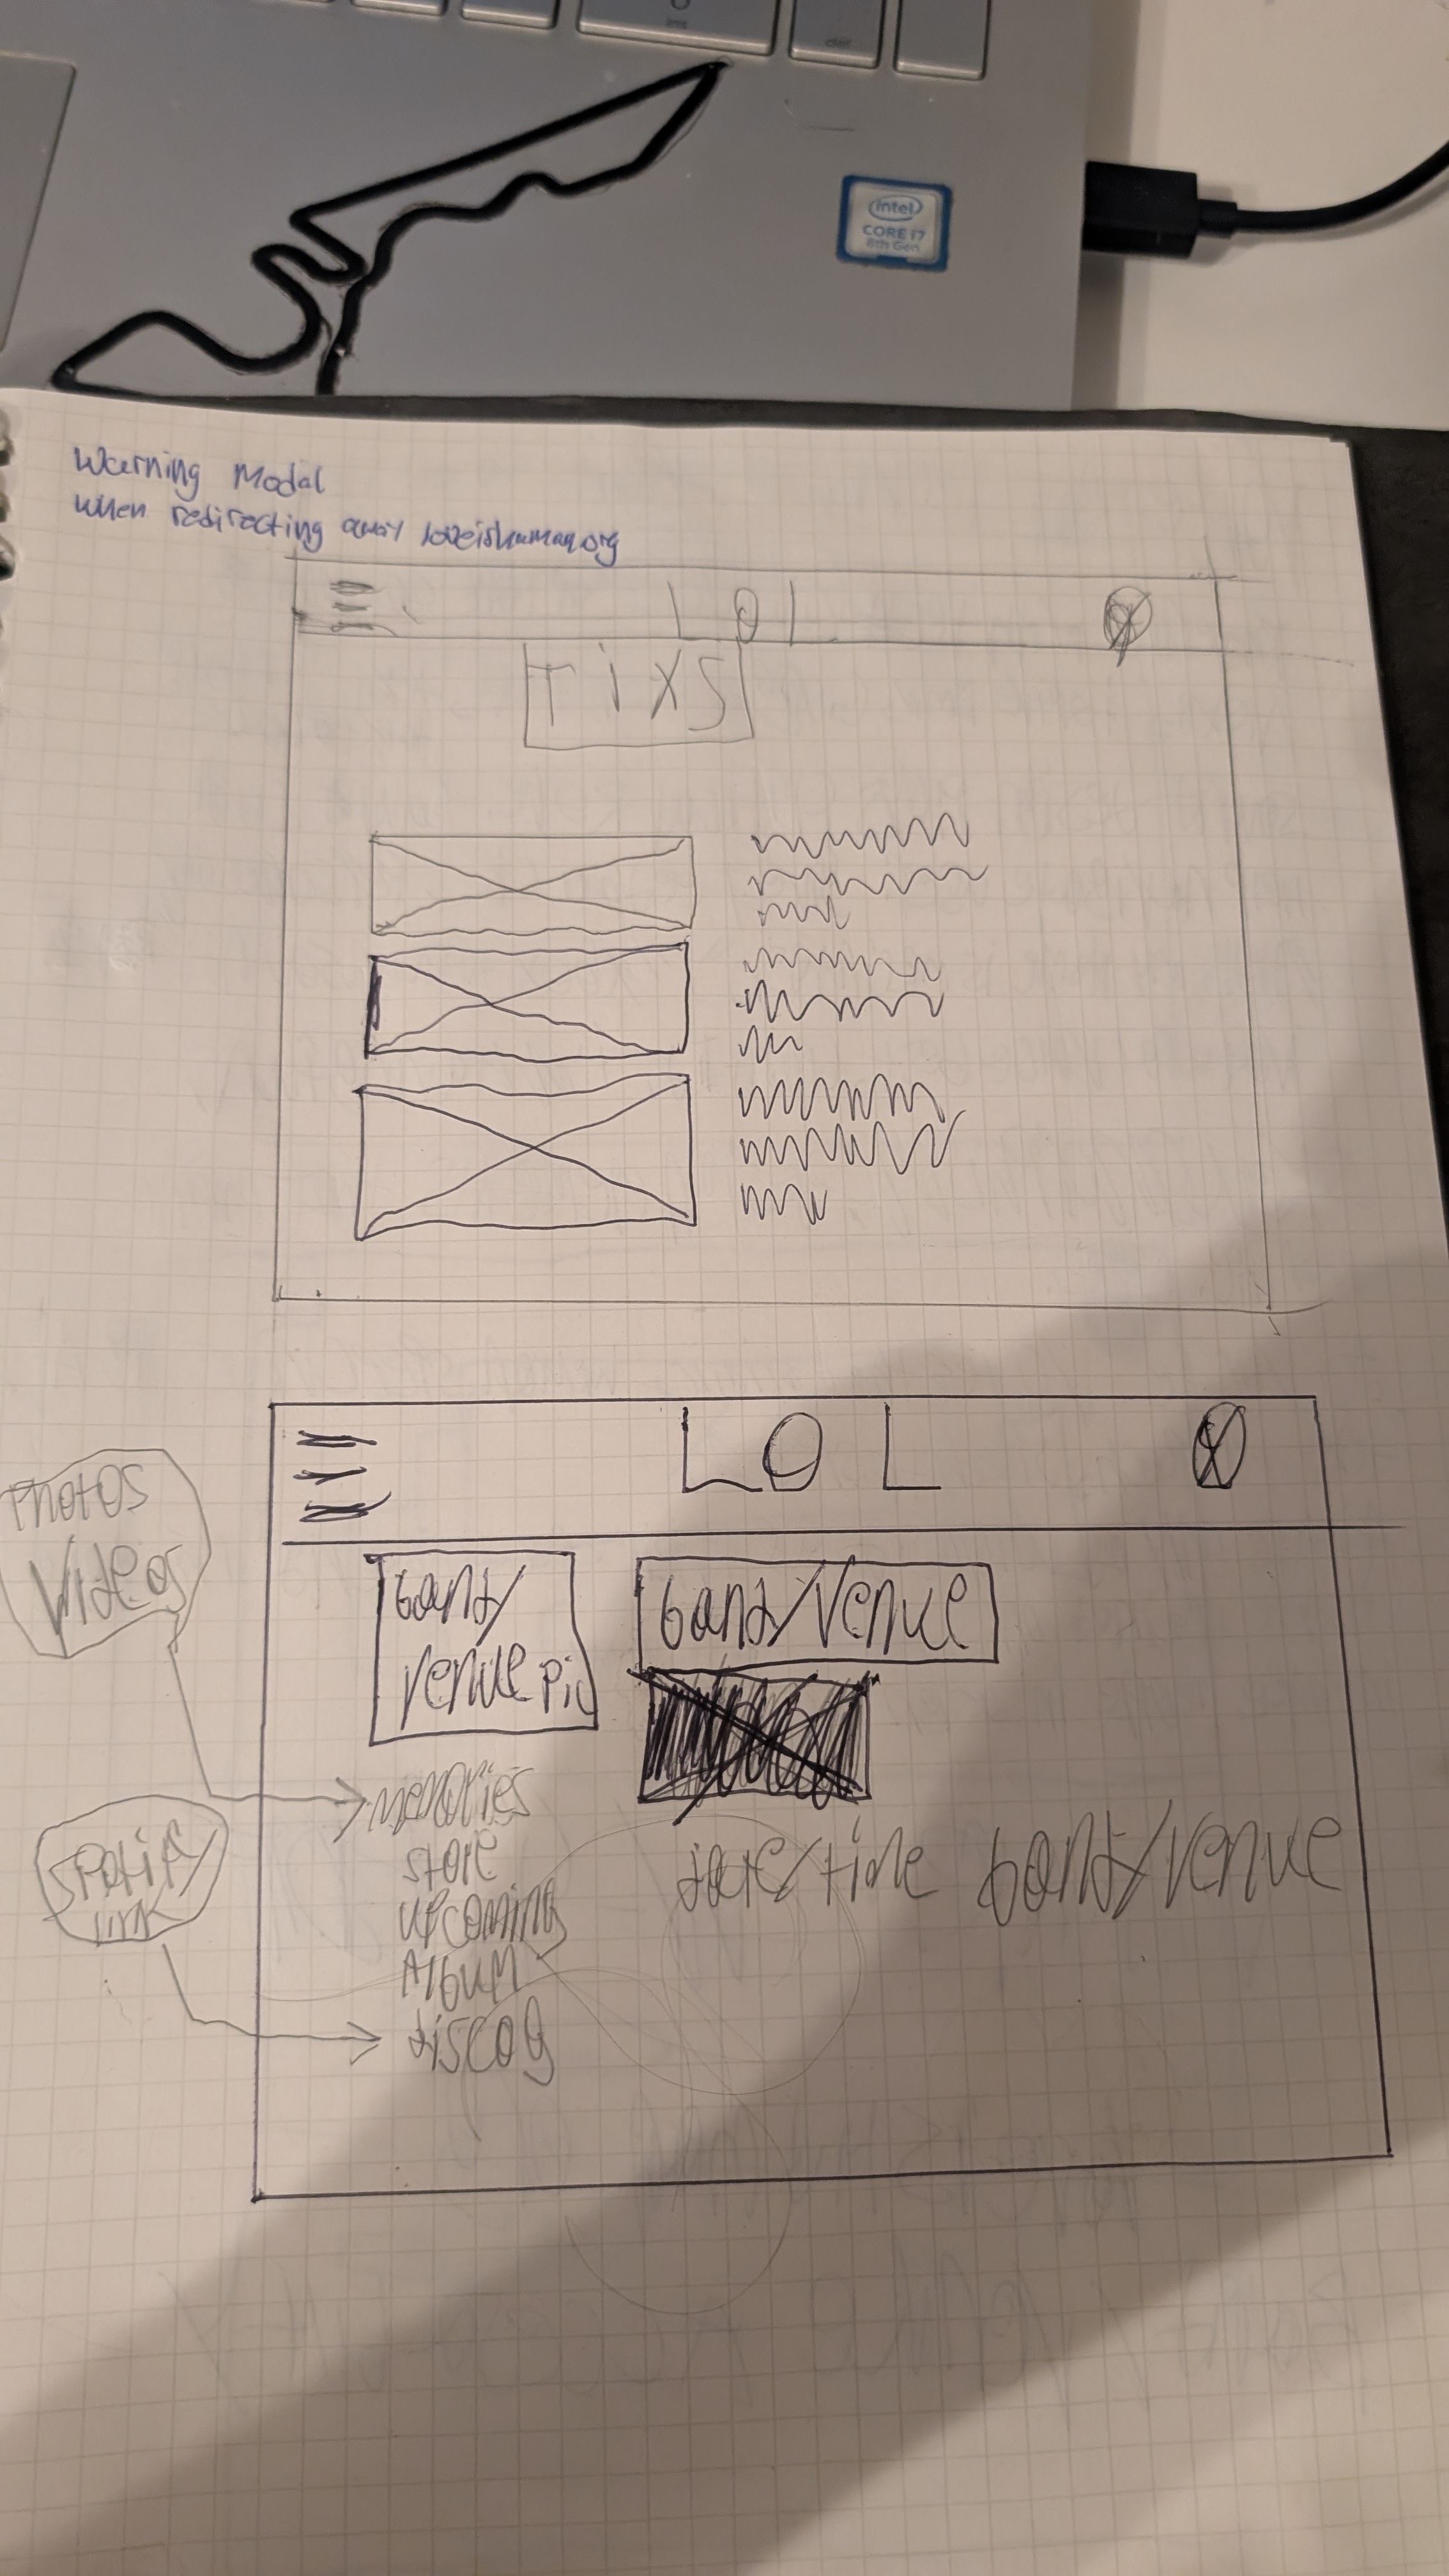
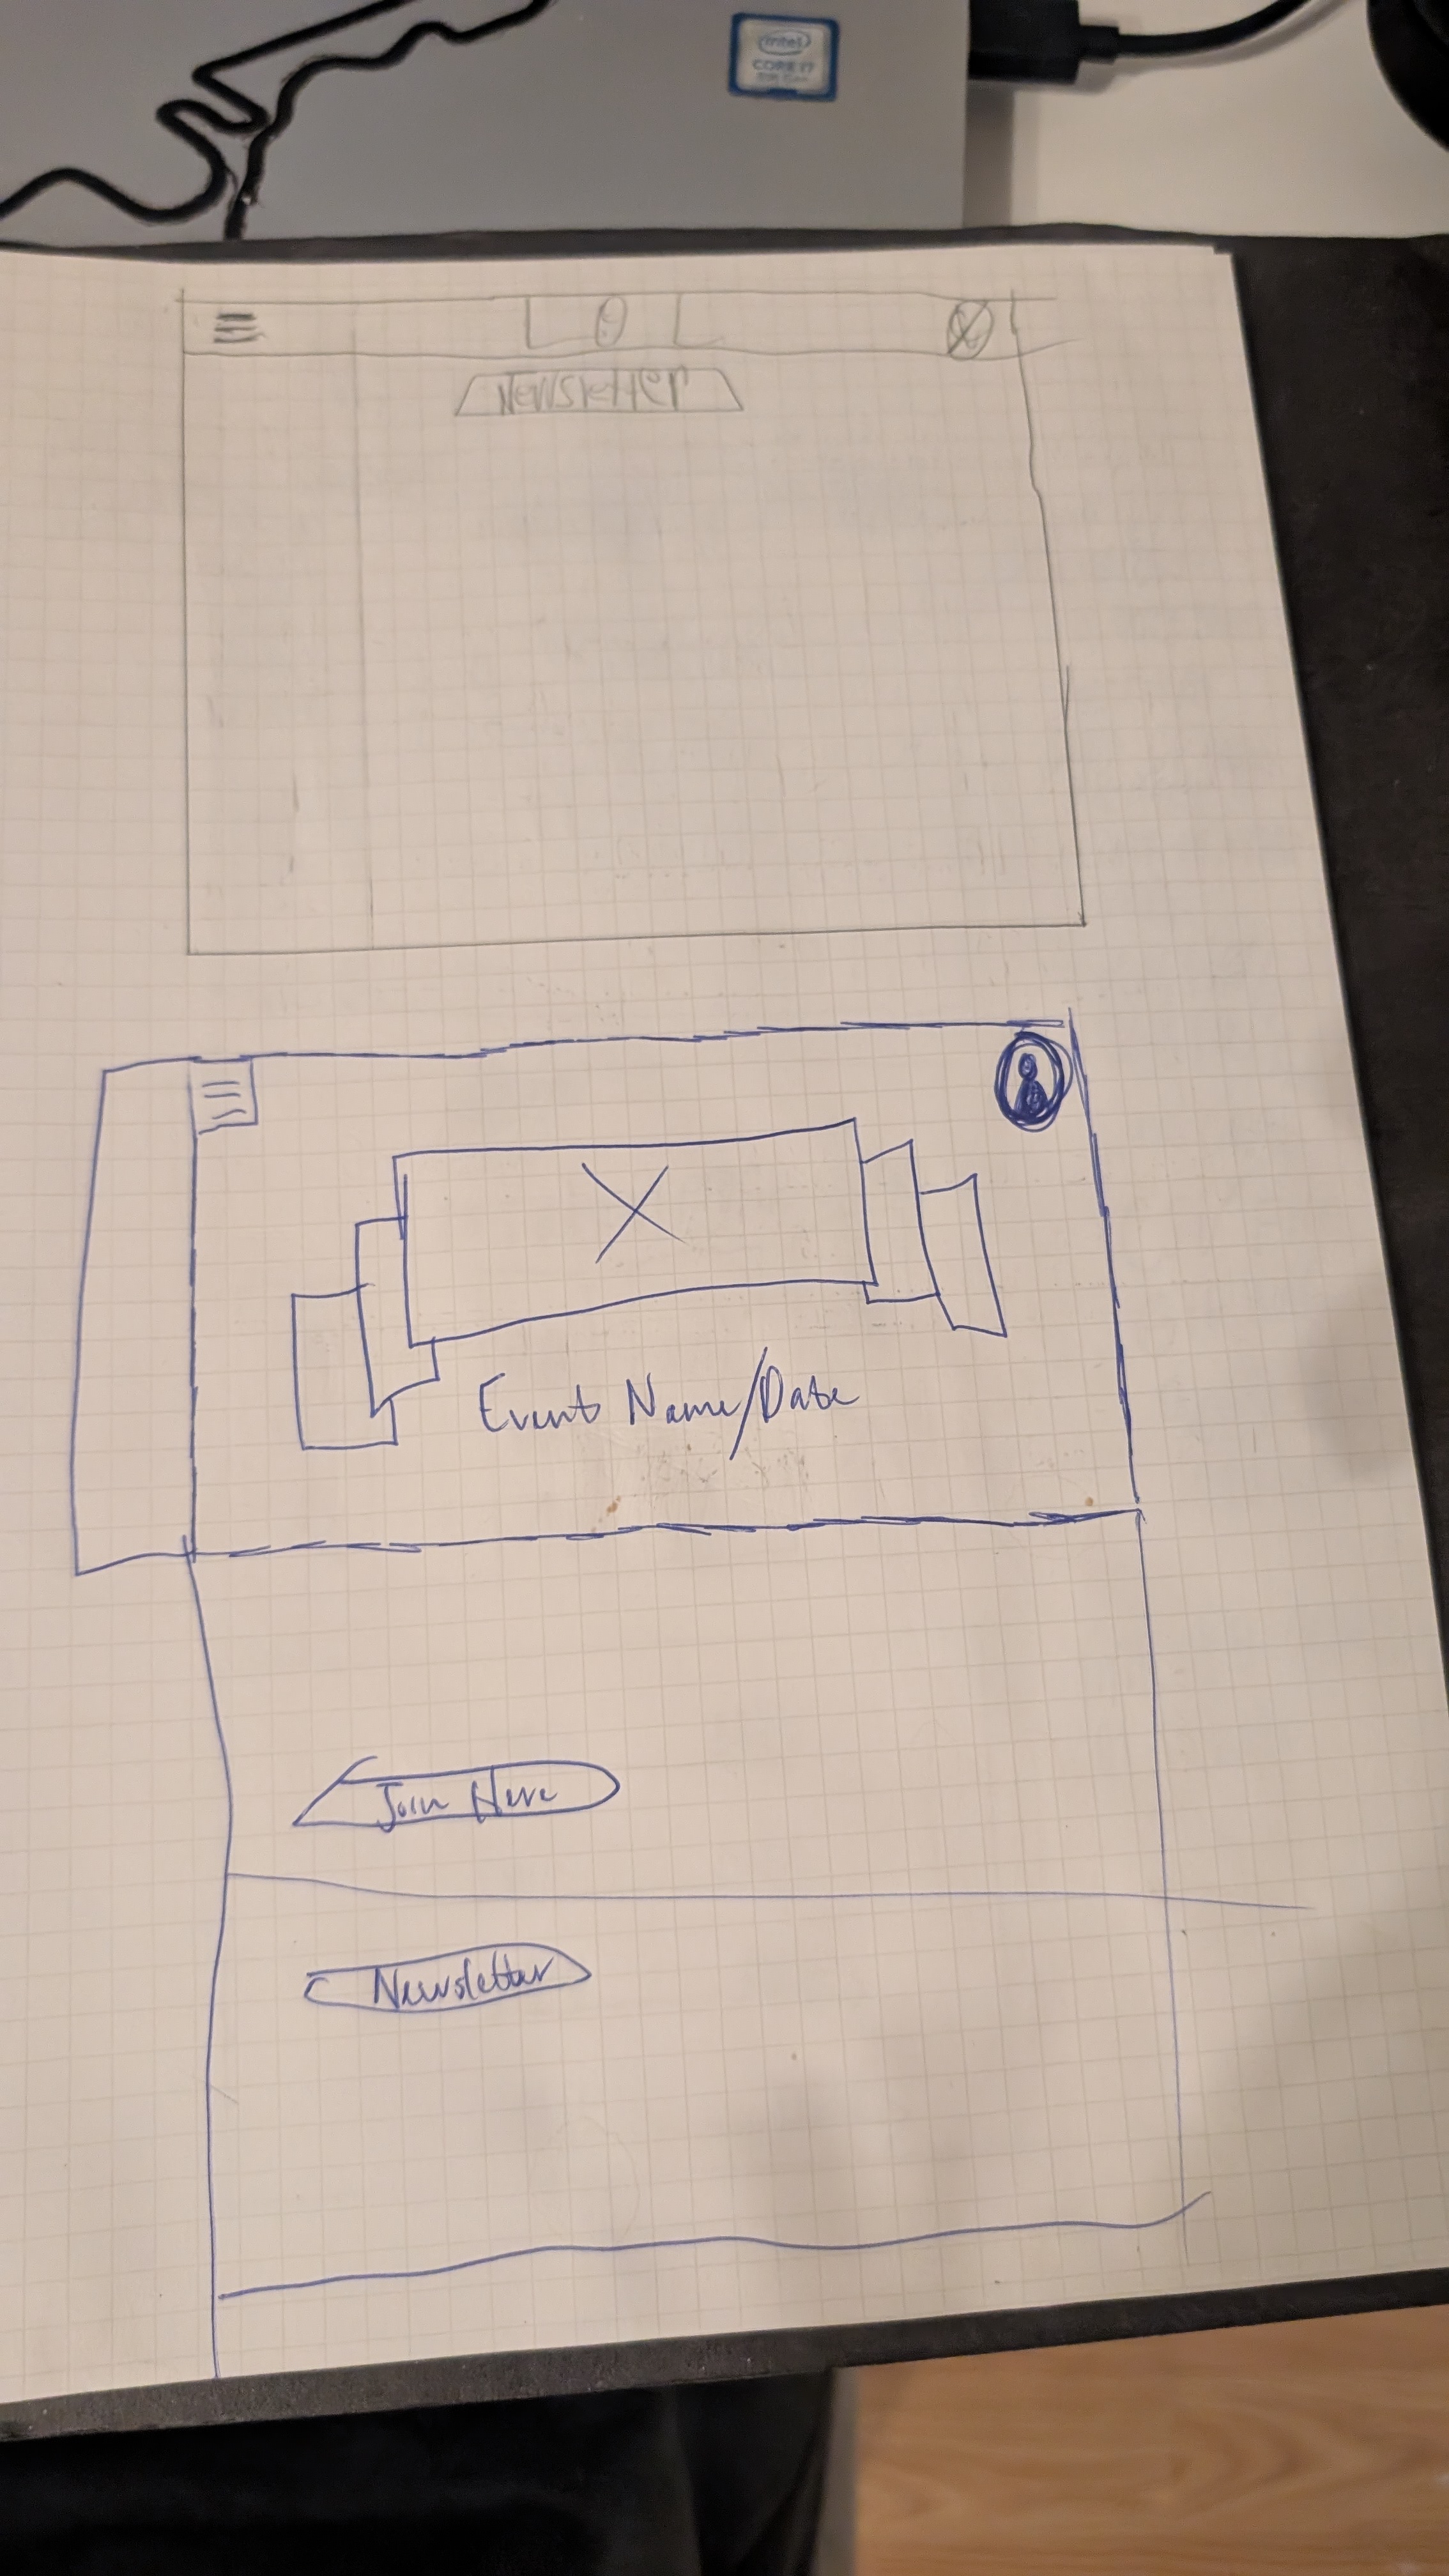
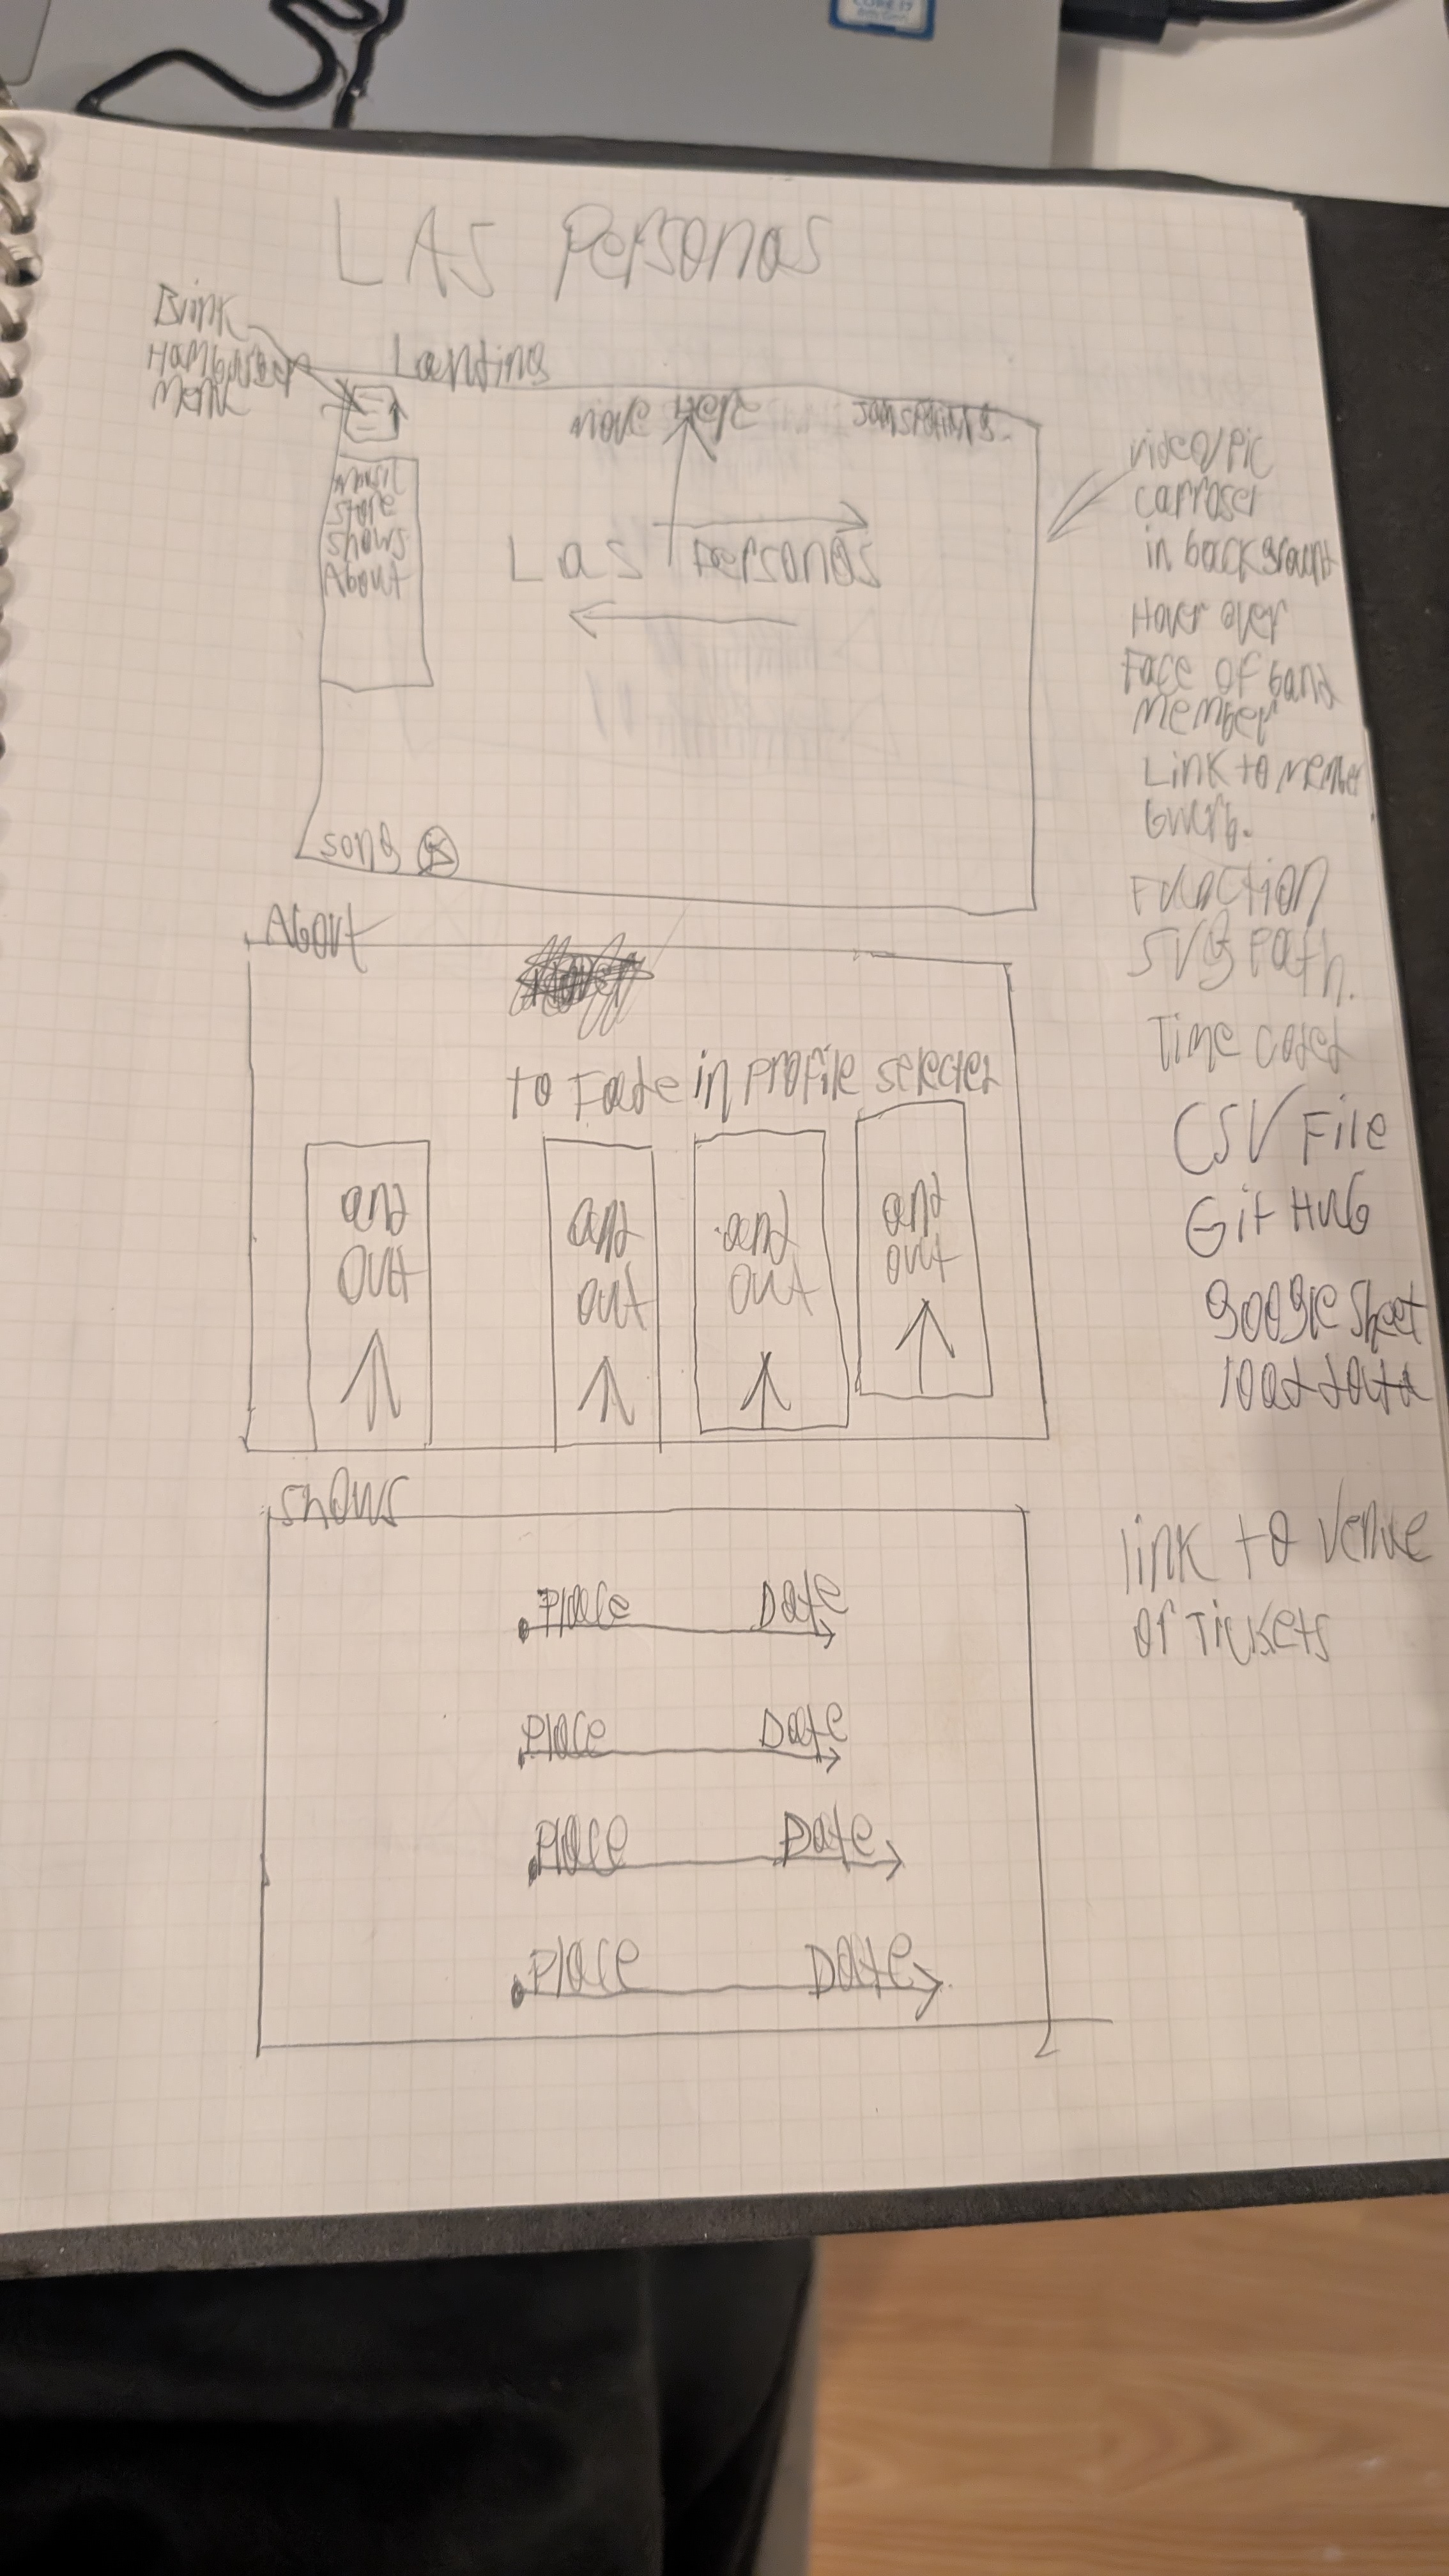
First pass: pen on graph paper, one frame per screen, margin notes capturing the features and constraints as they came up. These fed the annotated digital wireframes below.
The process · 02
Translated to digital.
Greyscale digital wireframes locked in the grid, component sizes, and IA before any color or brand decisions. The biggest commitment here was the three-column desktop layout — a persistent left sidebar for browse modes, a center feed of show cards, and a right rail for filters always in view. That structure became the spine of every other screen.
Annotated digital wireframes · 3 screens
Greyscale layouts for the discovery feed, show detail, and band profile — each with numbered annotations explaining the IA choices that survived into the hi-fi designs below.
The system
Built a visual language.
Before pushing into hi-fi, I locked the visual system: a dark canvas, white type, and a single purple accent. The dark theme lets show artwork — the most varied content on the page — be the loudest visual element on every screen. Purple anchors interactive moments (CTAs, active filters, badges) so fans always know what's tappable.
Color palette
Typography — Inter
Components
Buttons
Filter chips
Badges
The process · 03
High-fidelity design.
The visual treatment uses a dark canvas, white type, and a single purple accent — chosen to read as "music platform" rather than "generic SaaS," and to stay distinct from competitors like Bandsintown (red) and Songkick (white). The dark theme also lets show artwork — the most varied content on the page — be the loudest visual element on every screen.
Four screens carry the show-discovery story end to end. Each is a clickable hi-fi mockup, not a flat image:
Discovery feed
The fan landing experience. Persistent left sidebar for browse modes, a center feed of show cards designed for 3-second decisions, and a right-rail filter set that's always visible — replacing the buried "Advanced search" link that 4% of users opened.
Filter modal — the "drill-in" state
When fans want to drill in: genre + sub-genre, calendar with per-day show density, location with neighborhood chips, price range, vibe descriptors, ages — with a live match count in the footer so users see filter impact before applying.
Show detail
Designed for a fan to decide on the ticket in under a minute. Sticky ticket card with tiered pricing, full lineup, venue facts and parking, fan count for social proof, mini-player to preview the band, countdown to doors — every conversion-relevant signal on one page.
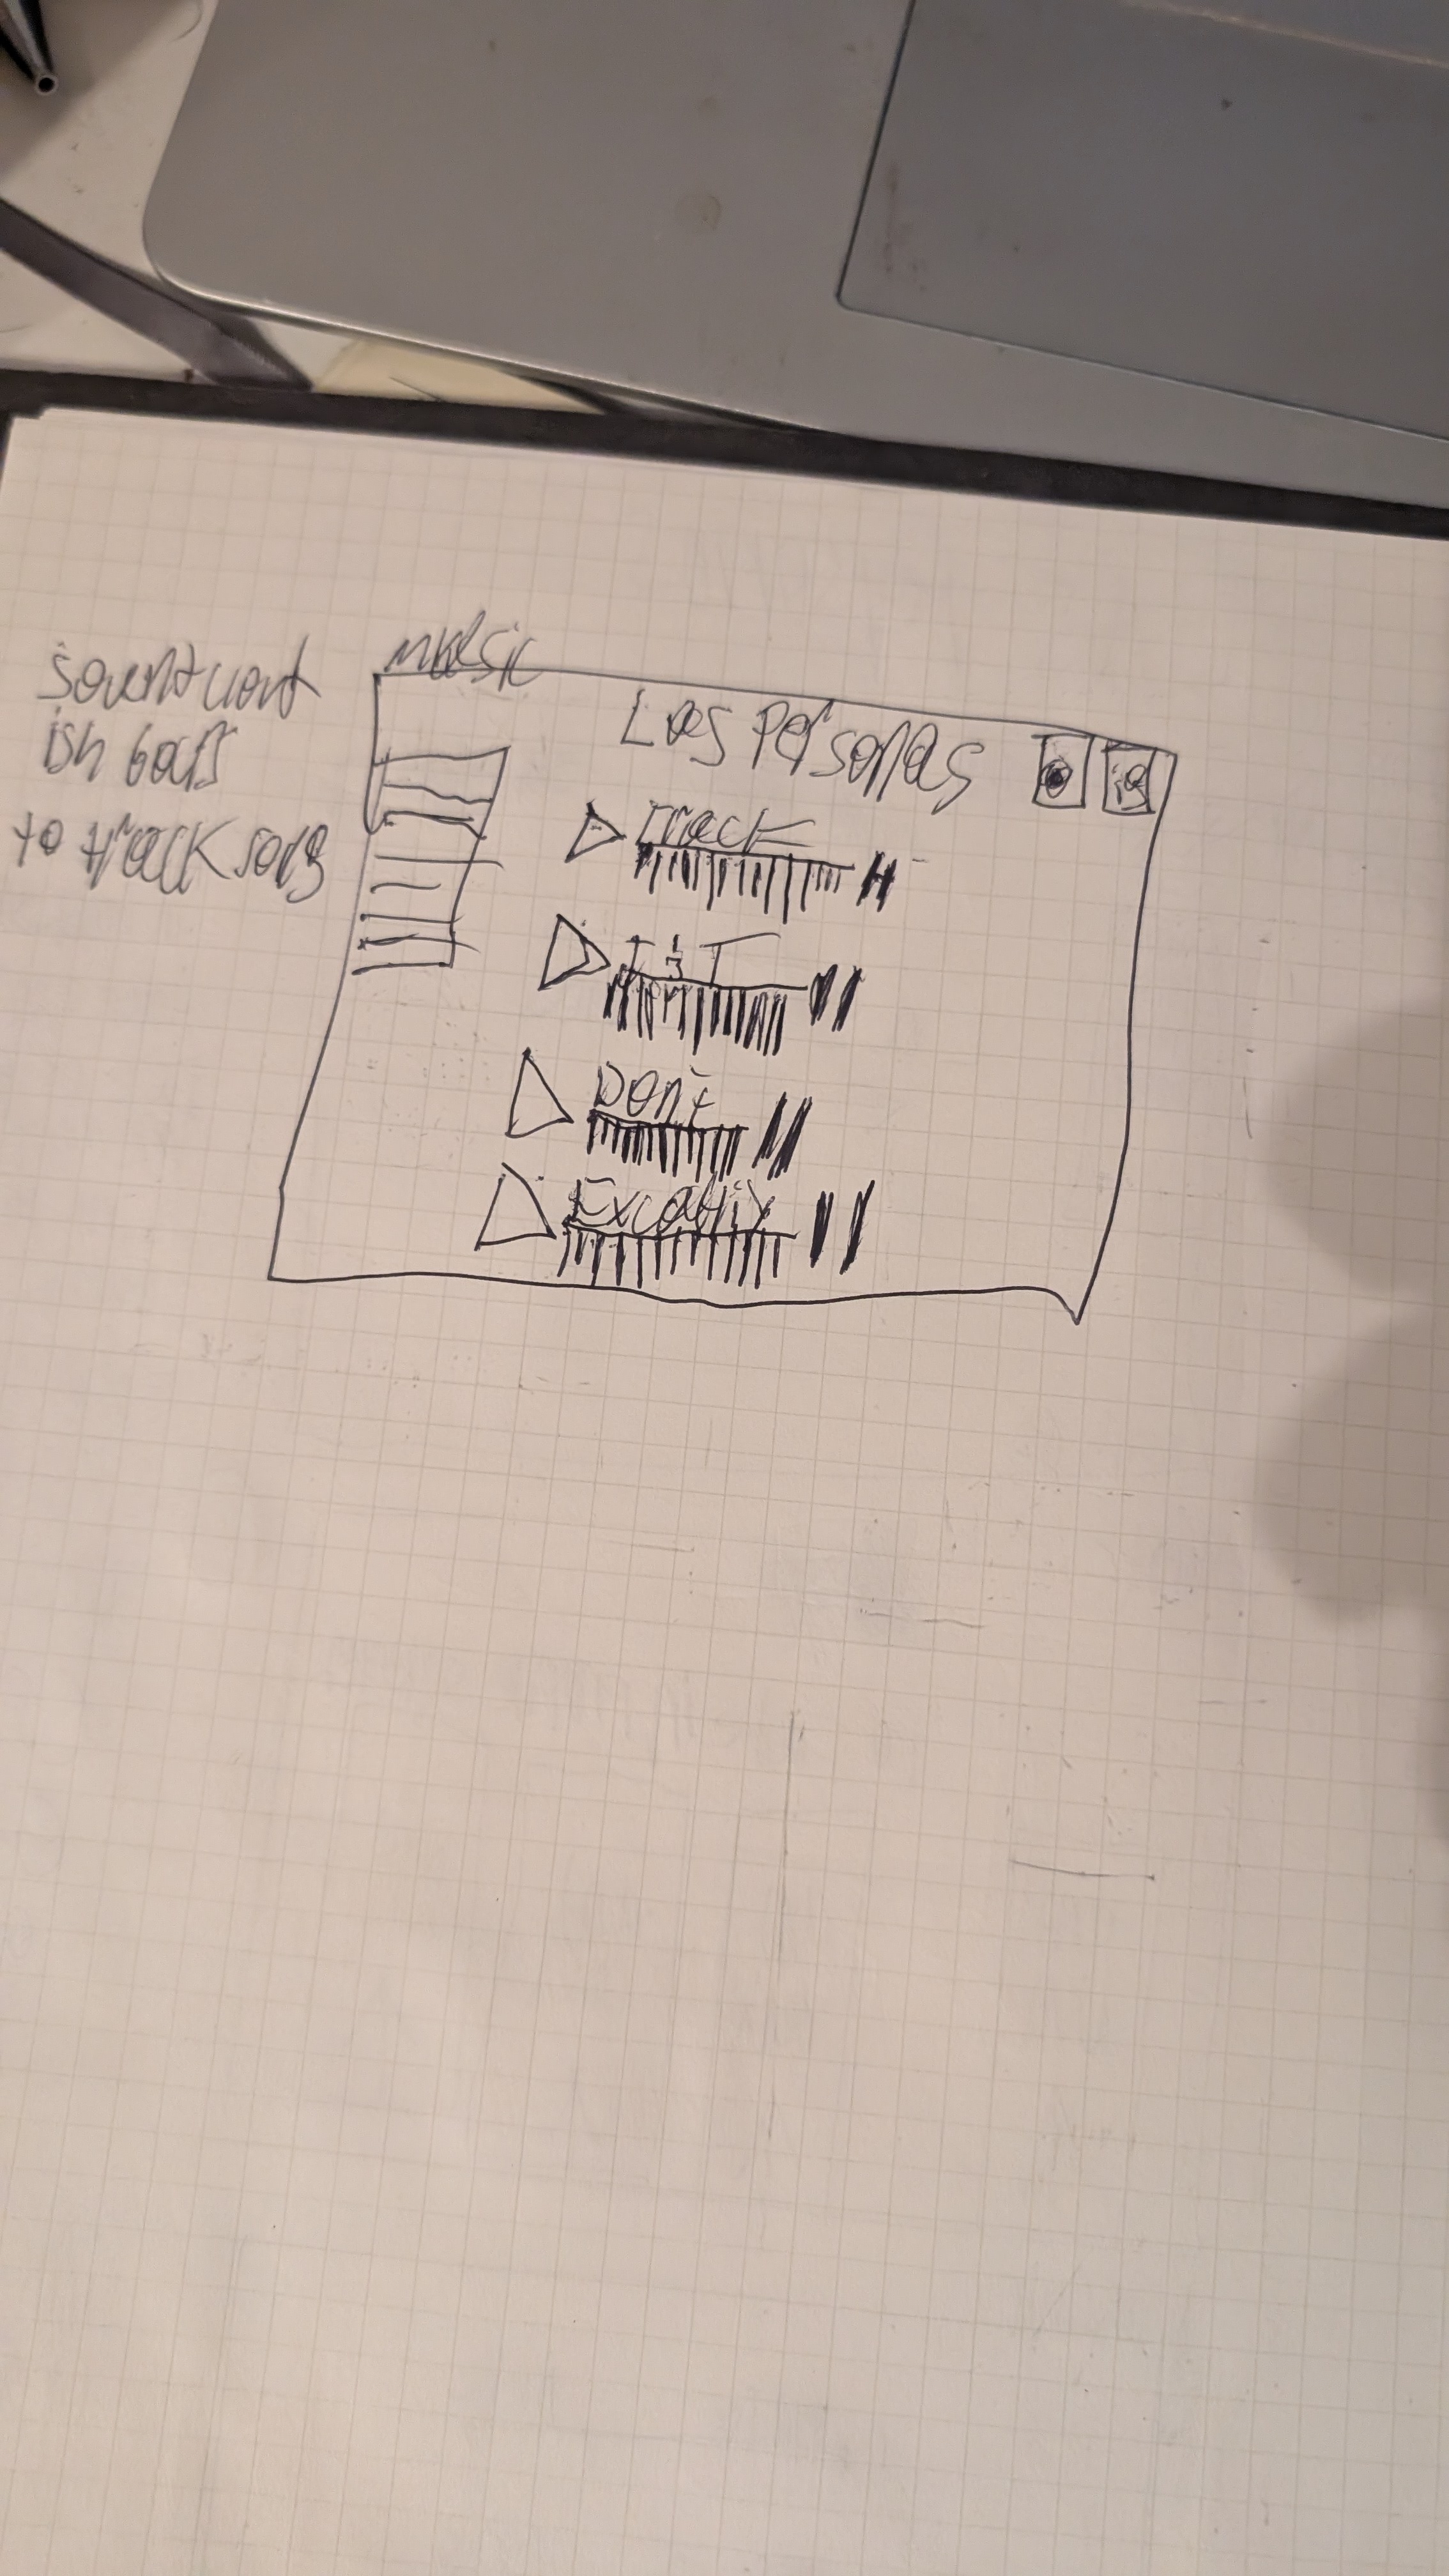
Band profile — Las Personas
The band's mini-website inside Love Is Human. Carousel hero with hoverable member avatars, stat strip for credibility, tabs for Music / About / Press / Merch, and an upcoming-shows list that's the main conversion path back into the discovery loop.
The work didn't make Love Is Human prettier. It made it findable.
What changed when filters moved from "Advanced search" to the right rail
The outcome
Fans came back.
The headline result was a 25% lift in user retention on the platform after the redesign shipped — fans were finding shows they wanted to attend, and coming back to find more. The filters that had been buried behind "Advanced search" now lived in the right rail and were used regularly. The show detail page, by surfacing venue, price, and lineup together, did the conversion work the discovery feed couldn't.
Measured after the redesigned show-discovery experience shipped to fans on the Love Is Human platform.
Reflection
What I'd do differently.
Ship the filters before the visual refresh.
Most of the 25% retention lift came from putting filters in front of fans, not from the dark + purple visual treatment. If I could re-cut the project, I'd ship the IA changes a sprint earlier as a pure functional update — then layer in the design system afterward. Faster impact, cleaner attribution.
Mobile should have been first, not last.
Desktop was the right scope for the case study and for the original brief, but most fans actually browse shows on their phone in line for coffee or on a lunch break. The desktop design holds up — but a phone-first redesign would have surfaced different priorities (one-tap "shows near me," map view) and probably moved retention further.