Case study · 2025
Battery House
Energy all the time.
Battery House is a companion app for a rechargeable battery pack that uses recycled cells to hold power with a modular in/output design. Owners can route energy in from the grid, solar, wind, or a backup generator — and feed it out to the home as needed. The app gives them a single dashboard to monitor, configure, and balance every input.
The problem
Homeowners want clean, reliable power — but the market is built for installers, not for them.
I interviewed ten homeowners and built empathy maps to surface the real friction. A primary user group emerged: homeowners aged 30–80 who want to lower utility bills, reduce their carbon footprint, and ride out the disruptive weather that's become routine in places like Texas. They were not battery experts — they were people trying to make a long-term financial and environmental bet without getting fleeced.
What kept coming up was that the existing options either treated them like contractors (technical jargon, no friendly UI) or like marks (greenwashed marketing, hidden costs, lock-in). Nobody was building a calm, honest interface for the homeowner sitting at their kitchen table making the decision.
High cost of competition
Most sustainable battery setups are priced out of reach for the average homeowner.
Wants to lower the utility bill
The core motivation isn't ideology — it's a household budget that keeps creeping up.
Disruptive weather, often
Many users live in remote or storm-prone regions where outages are no longer rare events.
The research
A real market, and a real hesitation.
Home battery storage is no longer a fringe purchase, but the price tag and the sales pitch around it still keep most homeowners on the fence. A companion app can't lower the cost of the hardware — but it can lower the cost of understanding it.
Figures are illustrative, based on industry estimates for residential battery storage costs, weather-outage frequency, and adoption barriers (Wood Mackenzie, EIA, market research aggregators, 2025).
The user
Meet Heath Martin.
A composite persona built from the research — Heath stands in for the user group whose decisions Battery House has to win.
Goals
- Reduce household carbon footprint by integrating sustainable tech that aligns with a greener lifestyle.
- Find an affordable, eco-friendly battery solution that doesn't require a contractor visit.
- Keep the lights on through summer storms without paying for a luxury Powerwall.
Frustrations
- High cost of sustainable tech — most options are priced out of reach for an average homeowner.
- Greenwashing in the market — marketing claims that don't survive a five-minute spec sheet.
- Setup complexity — apps that assume an installer is doing the configuring.
Nobody was building a calm, honest interface for the homeowner sitting at their kitchen table making the decision.
The insight that anchored every design choice
The architecture
One dashboard, four source pages.
The research pointed at a single structural decision: people want to see everything at once. The moment they have to click between sources just to compare them, the dashboard has failed its main job. So the information architecture is hub-and-spoke — one main dashboard shows the whole system at a glance, and each of the four inputs drills into its own page built from the same template, so the pattern only has to be learned once.
Main dashboard
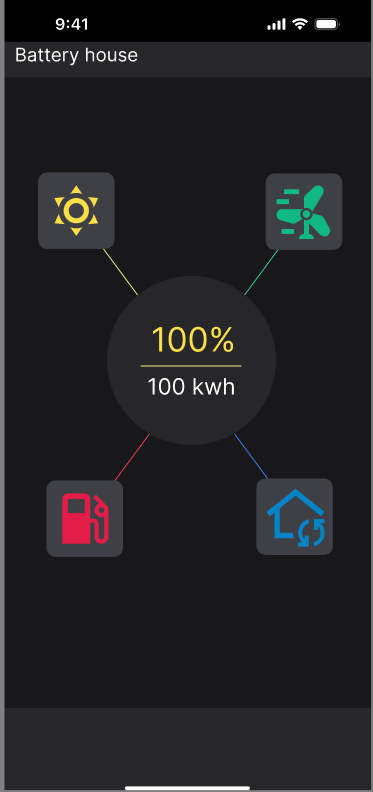
Source-switcher plus a live battery readout — the whole system at a glance.
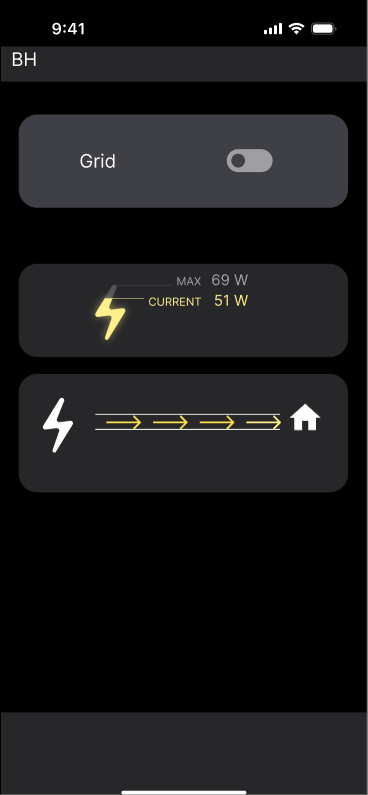
Grid
Energy in from the grid, with live flow direction.
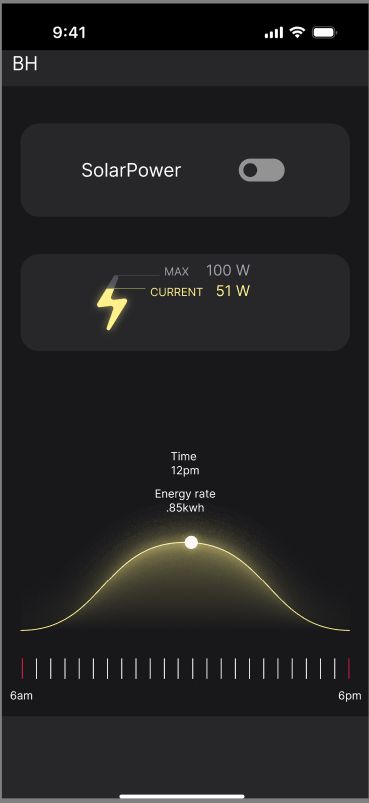
Solar
Projected output across the day, on a time slider.
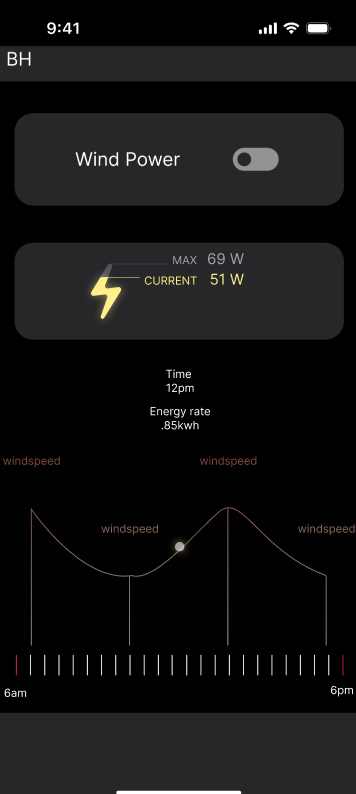
Wind
A windspeed timeline feeding the turbine input.
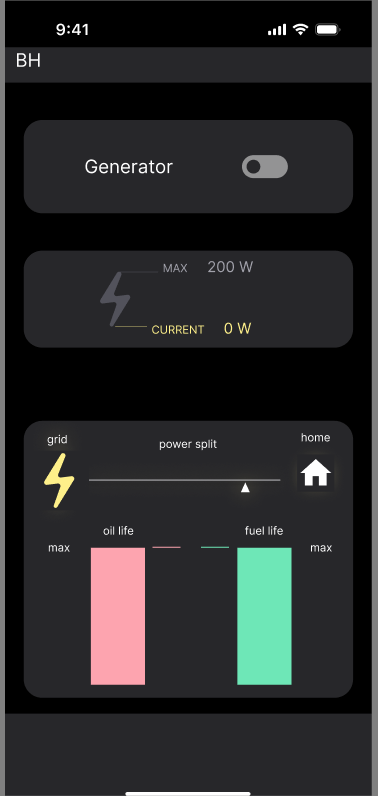
Generator
Backup source with fuel gauges and a priority override.
The process · 01
Started on paper.
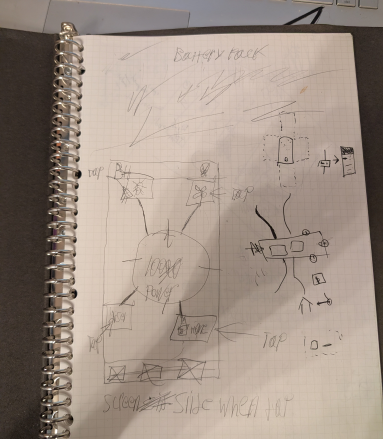
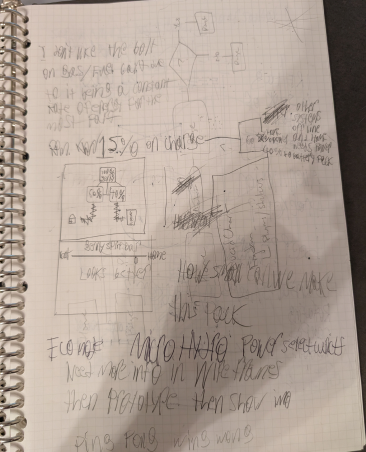
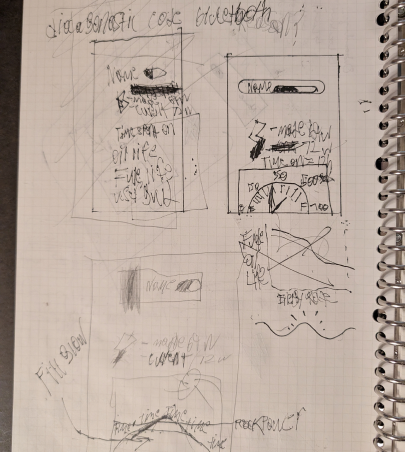
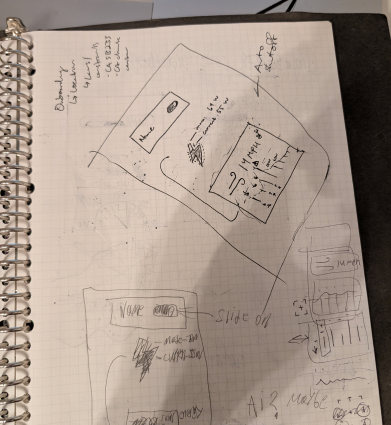
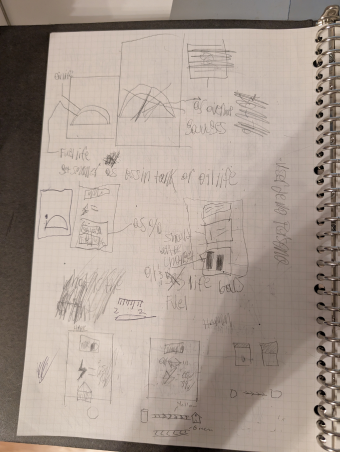
I sketched every screen by hand first to keep the focus on flow rather than aesthetics. The core question was: how does someone toggle between four input sources and see what's happening at a glance? Paper let me run through the four power-source pages without getting precious about layout. The answer that survived to digital was a single dashboard with a source switcher and a live readout, rather than a separate top-level page per source.
The process · 02
Translated to digital.
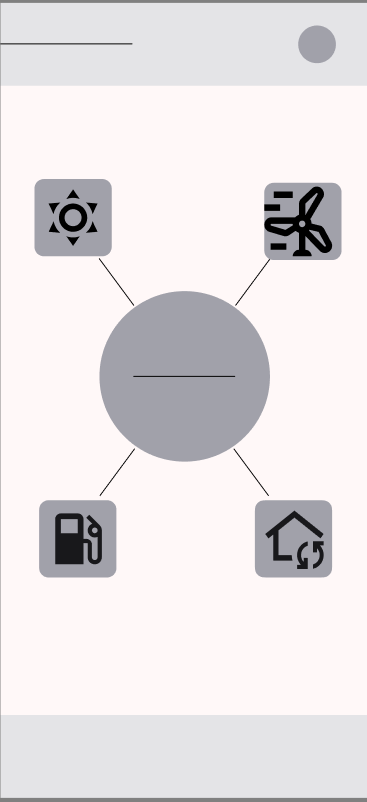
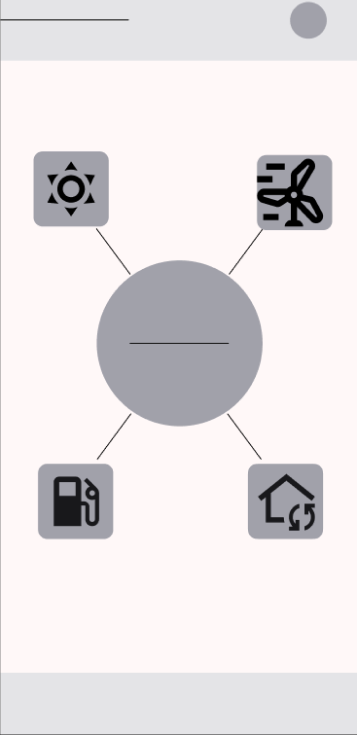
With the flow locked in on paper, I moved to digital wireframes to commit to a layout grid and start spacing decisions. Each input source got its own page off the main dashboard — but with a consistent template so the user only learns the pattern once.
 1
2
3
1
2
3
- 1Source-switcher hub — tap to see which input is feeding the battery.
- 2Power-source icons — solar, wind, grid, generator, arranged around the hub.
- 3Account / status — the persistent header across every screen.
 1
2
3
1
2
3
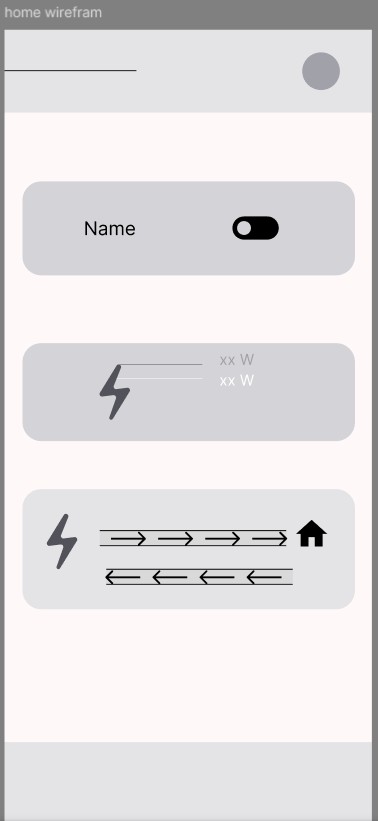
- 1Source toggle — switch this input on or off.
- 2Live wattage readout — current draw, at a glance.
- 3Grid flow direction — energy moving in from the grid, out to the house.
 1
2
3
1
2
3
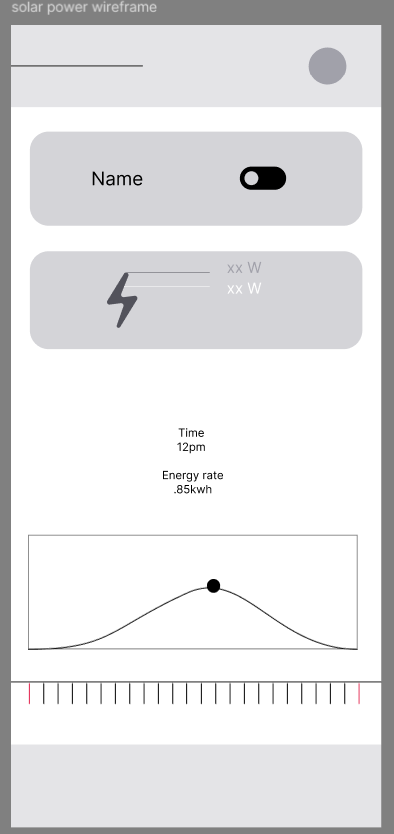
- 1Source toggle — switch this input on or off.
- 2Live wattage readout — current draw, at a glance.
- 3Solar output curve — projected output across the day, with a time slider.
 1
2
3
1
2
3
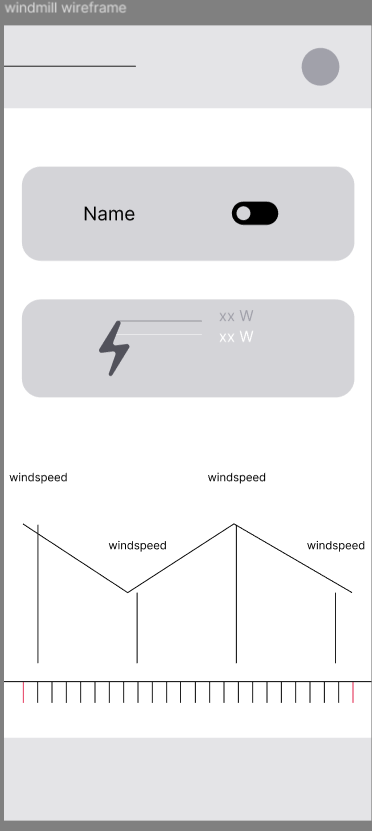
- 1Source toggle — switch this input on or off.
- 2Live wattage readout — current draw, at a glance.
- 3Windspeed timeline — how much the turbine has to work with, over time.
 1
2
3
4
1
2
3
4
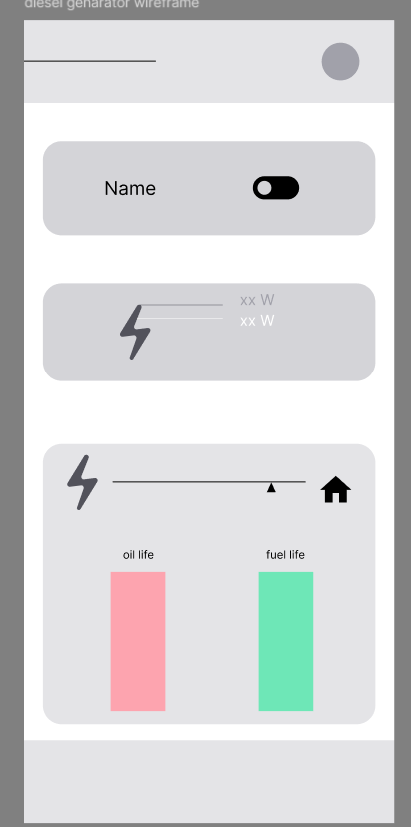
- 1Source toggle — switch this input on or off.
- 2Live wattage readout — current draw, at a glance.
- 3Prioritize this source — the one honest override, for a real outage.
- 4Oil & fuel gauges — the maintenance check unique to a generator.
Low-fidelity prototype
Each input source got its own page.
Once the dashboard pattern locked in, I built out a low-fi prototype with a dedicated screen for each of the four power sources — grid, solar, wind, and generator — plus the main hub. Each source page surfaces the same three things: current input level, contribution to the battery, and a tap to prioritise that source.
The final design
The interactive prototype.
The full flow, embedded live and clickable — tap through the four power-source pages and the source-switcher hub right here, without leaving the page. Prefer full screen? Open it in Figma ↗.
Live prototype embedded above. If it shows a sign-in prompt instead of the app, the Figma file's link sharing needs to be set to "Anyone with the link can view."
The outcome
A calm dashboard, and a prototype to prove it.
Battery House is a concept project, so the outcome is the design itself: a coherent system that takes a homeowner from "which source is running my house right now?" to a confident answer in a single screen. The paper → digital → prototype path produced a testable artifact the hardware side could react to, not just a set of pretty screens.
A main hub plus four source pages, all sharing one template so the interaction is learned once.
Grid, solar, wind and generator unified under a single source-switcher instead of four disconnected readouts.
Research, persona, paper and digital wireframes, and a clickable prototype inside a four-week sprint.
Reflection
What worked, what I'd do differently.
What worked
Keeping the four power sources on a single dashboard rather than splitting them into separate top-level pages. The user research clearly showed people want to see everything at once — the moment they have to click between sources to compare them, the dashboard fails its primary job. The hub + drill-down pattern resolved this.
What I'd revisit
The persona was tight on goals and frustrations but light on behavioural context — what time of day Heath actually checks the app, whether he's a glance-and-go user or a tinkerer. A second round of contextual interviews would have sharpened the priority of dashboard elements and helped tune the notification model, which is still un-resolved.